
Gold Price History: A Century of Value
Gold price history tells the story of how a metal once fixed by government decree became one of the most closely watched, freely traded assets on Earth — and nowhere has that story moved faster than the past two years.
In the early 1900s, gold was pegged under the Gold Standard at roughly $20.67/oz until 1933. Through the Great Depression and World War II, the US raised its official gold price to $35/oz, a level that held until 1971, when the Nixon Shock finally decoupled gold from the dollar entirely.
That decoupling triggered dramatic swings through the 1970s — driven by oil crises, runaway inflation, and political instability — with gold peaking near $850/oz in January 1980. Prices moderated through the 1980s and 1990s as economies stabilized, before the 2000s brought a sustained bull run through the global financial crisis, crossing $1,900/oz in 2011.
The COVID-19 pandemic pushed gold above $2,075/oz in August 2020, and from there, the gold price history of 2024 through early 2026 became genuinely unprecedented — gold didn’t just set new highs, it redefined what “high” meant for the metal entirely.
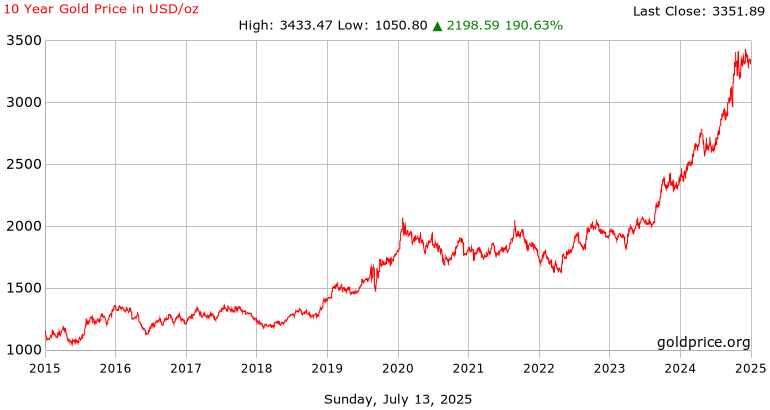
Gold Price History by Decade: Trends and Insights
The history of gold prices across the past six decades reflects global economic and political events almost point for point. In the 1970s, after the US abandoned the gold standard in 1971, gold soared from around $35/oz to over $850/oz by 1980, driven by oil shocks, inflation, and geopolitical tension.
The 1980s saw gold decline sharply as central banks raised interest rates and inflation came under control, stabilizing broadly between $300–$500/oz. The 1990s were quieter still, with gold trading largely sideways near $300/oz as strong equity markets pulled investment demand elsewhere — 1999 in particular marked a modern-era low near $255/oz.
The 2000s marked a genuine bull run, climbing from roughly $280/oz in 2000 to over $1,100/oz by 2009, fueled by financial crisis, a weak dollar, and surging demand from China and India. The 2010s opened with gold hitting $1,900/oz during the 2011 Eurozone debt crisis, before consolidating between $1,100–$1,500/oz through the back half of the decade.
The 2020s, though, have been genuinely extraordinary. Gold surged past $2,075/oz during the 2020 pandemic, held firm through 2021–2023 amid persistent inflation, then broke into an entirely new regime: crossing $2,700/oz for the first time in October 2024, surpassing $3,500/oz by mid-2025, breaching $4,000/oz for the first time in October 2025, and ultimately hitting an all-time high of $5,589.38/oz on January 28, 2026. Updated decade summary:
| Decade | Key Trend | Price Range |
|---|---|---|
| 1970s | Inflation & oil shocks | $35 → $850 |
| 1980s | Stabilization | $850 → $300 |
| 1990s | Weak demand | ~$255 – $300 |
| 2000s | Financial crisis | $280 → $1,100 |
| 2010s | Debt crisis & QE | $1,100 → $1,900 |
| 2020s (to date) | Pandemic, war, de-dollarization | $1,900 → $5,589+ |
Factors That Shaped Gold Price History
Gold prices across the decades have been shaped by a consistent mix of economic, political, and monetary forces, making gold one of the most sensitive indicators of global stability available to investors.
War and geopolitical conflict remain among the biggest drivers. World War II, Middle Eastern conflicts, the 1970s oil embargo, and more recently the Russia-Ukraine war and renewed Middle East tensions through 2025–2026 have all pushed investors toward gold as a safe haven, driving prices sharply higher during periods of acute uncertainty.
Inflation and currency devaluation matter just as much. During the high-inflation years of the 1970s, gold surged from $35/oz to over $850/oz as investors sought to protect purchasing power; when inflation came under control in the 1980s–1990s, gold fell or stagnated for years. The renewed inflation concerns of 2023–2026 have played a similarly central role in gold’s latest run.
Central bank policy and monetary conditions shape gold’s appeal directly — when rates fall or central banks pursue quantitative easing, as in 2008 and again through 2024–2025, the opportunity cost of holding non-yielding gold drops, boosting demand. Perhaps most significantly, central bank gold buying itself has become a defining feature of the current cycle: China, India, Poland, and Turkey have added gold to reserves at record pace since 2022 as part of a broader de-dollarization trend, with central banks adding over 1,000 tonnes annually in 2023–2024 alone, and China’s central bank alone extending its buying streak to 20 consecutive months by mid-2026.
Economic crises consistently trigger flight-to-safety demand — the 2008 financial crisis and the COVID-19 pandemic both drove gold to new highs as investors sought shelter from broader market instability. Together, these forces explain gold’s dramatic price swings across a century of history: a genuine hedge against inflation, war, and financial uncertainty.
Gold’s All-Time High: How High Has Gold Actually Gone?
Gold’s highest price in history stands at $5,589.38 per ounce, reached on January 28, 2026 — a record that capped one of the most dramatic runs in the metal’s trading history.
To put the scale of this move in perspective: gold started 2025 trading around $2,624/oz. By late spring 2025, it had pushed decisively above $3,500/oz. By September 7, 2025, gold’s rally officially surpassed the inflation-adjusted 1980 peak of $850/oz (roughly $3,590 in today’s dollars).
By October 2025, gold crossed $4,000/oz for the first time ever, and by late December 2025 it hit a year-end peak of $4,549.74/oz — before accelerating even further into January 2026’s record close above $5,500.
Since that January 2026 peak, gold has pulled back meaningfully, trading in the $4,000–4,200/oz range through mid-2026 amid shifting Federal Reserve policy expectations and broader market volatility — still dramatically above anything seen before 2025, even after the retracement.
Annual Gold Price History (USD/oz)
| Year | Avg Price (USD/oz) |
|---|---|
| 2000 | $279 |
| 2010 | $1,226 |
| 2015 | $1,060 |
| 2020 | $1,770 |
| 2023 | ~$1,940 |
| 2024 | ~$2,390 (crossed $2,700 in October) |
| 2025 | ~$3,400 (started at $2,624, peaked near $4,550) |
| 2026 (through July) | Peaked at $5,589.38 (Jan 28); trading ~$4,000–4,200 mid-year |
Gold Price History in Europe, the USA, India, and Global Markets — Comparison
Gold prices move broadly in line with global trends since gold is traded internationally in US dollars, but local prices in Europe, the USA, India, and elsewhere still reflect currency movements, taxes, and dealer premiums layered on top of the global benchmark.
In the USA, gold prices track the international spot market closely, since the dollar itself is gold’s benchmark pricing currency. In India, a major gold-consuming nation, prices run consistently higher than global spot thanks to import duties (around 12.5%) and GST stacking on top of currency effects from a historically weaker rupee. Dubai continues to offer some of the lowest premiums globally thanks to minimal taxation and deep trade networks, making it a genuinely preferred buying hub for international investors.
Europe is a slightly more nuanced case than the “higher VAT” framing often assumed. Investment-grade gold bars and coins at 99.5%+ purity are actually VAT-exempt across the entire EU, under Directive 98/80/EC — the same rule that keeps Germany, Belgium, Switzerland, and Austria genuinely competitive for serious bullion buyers.
Where European pricing does tend to run higher is dealer premium rather than tax: established European bullion dealers often carry retail markups above what buyers sourcing directly — including from African producers — typically pay. Our current 24K gold price per gram guide tracks exactly how this premium gap plays out at today’s prices.
Indicative Market Comparison (Mid-2026, 24K per gram)
| Market | Approx. 24K Price per Gram (USD) | Notes |
|---|---|---|
| Global spot | ~$133 | Baseline (based on ~$4,150/oz) |
| USA | ~$135 | Spot + minor dealer margin |
| Dubai | ~$131 | Lowest global premiums |
| India | ~$140 | Import duty + GST |
| Europe (retail dealer) | ~$138–142 | Dealer premium, not VAT — investment gold is VAT-exempt |
| Direct from African producers | ~$135–137 | 1–3% premium over spot, no intermediary markup |
What Is the Price of Gold in the DRC and Other African Markets?
In the Democratic Republic of Congo, gold prices generally track close to global spot, though informal trading channels can introduce modest discounts depending on purity verification and seller compliance. At current spot levels (~$4,150/oz), DRC pricing runs approximately $133–140 per gram, or roughly $133,000–140,000 per kilogram, with the exact figure depending heavily on documentation and purity certification. Our guide on gold mining in Congo covers the DRC’s production landscape in more depth, and our broader gold producing countries in Africa guide covers pricing dynamics across the continent’s other major producers.
Where Is Gold the Cheapest in the World?
Gold remains cheapest in Dubai, Hong Kong, and several African gold-producing nations — Ghana and Uganda among them — thanks to minimal import duties, low taxation, and direct proximity to mines and refineries that cuts out layers of intermediary markup.
For buyers specifically seeking the lowest all-in cost on investment-grade bullion, sourcing directly from African producers rather than through Western retail dealers consistently delivers pricing closer to true global spot.
Our gold investment opportunities in Africa guide explains why this direct-sourcing advantage has become such a significant draw for international investors, particularly given how dramatically gold has moved since 2024.
What Will Gold Be Worth in the Coming Years?
Forecasting gold is notoriously difficult — five-year-old predictions of “$2,500–3,000 by 2030” were comfortably exceeded years ahead of schedule once gold‘s 2024–2026 run took hold.
What analysts broadly agree on heading through 2026: the structural drivers behind gold’s recent surge — sustained central bank buying (particularly from China, India, and Turkey), persistent inflation concerns, and elevated geopolitical risk — show no clear signs of reversing.
Whether gold consolidates around current $4,000–4,200/oz levels, retests January 2026’s $5,589 high, or moves in an entirely new direction depends on factors that are genuinely hard to call this far out — treat any specific long-range price target with real skepticism, including ones in this article.
FAQ: Gold Price History
What was gold’s highest price ever? Gold’s all-time high is $5,589.38 per ounce, reached on January 28, 2026, capping an extraordinary run that saw gold cross $4,000/oz for the first time just three months earlier, in October 2025.
What is the price of gold in the DRC? As of mid-2026, DRC gold prices run approximately $133–140 per gram (roughly $133,000–140,000 per kilogram), tracking close to global spot with modest discounts common in informal trading channels.
What will gold be worth in the coming years? Long-range forecasts have consistently underestimated gold’s actual trajectory in recent years. Structural demand drivers — central bank buying, inflation concerns, geopolitical risk — remain firmly in place heading through 2026, but specific price targets beyond the near term should be treated with real caution.
Where is gold the cheapest in the world? Dubai, Hong Kong, and African gold-producing nations like Ghana and Uganda consistently offer the lowest premiums, thanks to minimal taxation and direct access to mines and refineries.
Is gold in Europe more expensive because of VAT? Not for investment-grade bullion — bars and coins at 99.5%+ purity are VAT-exempt across the entire EU. Higher European retail pricing typically reflects dealer premium rather than tax.